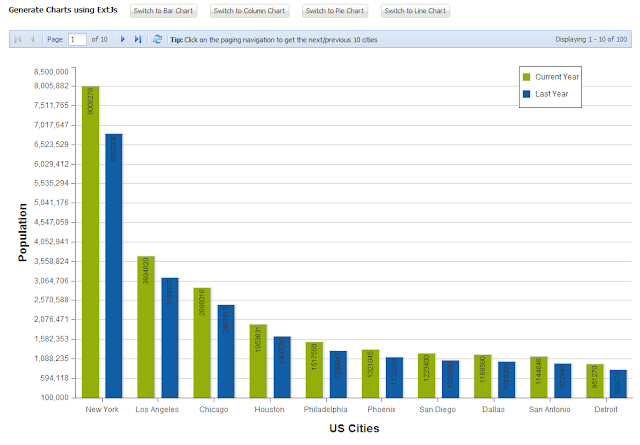
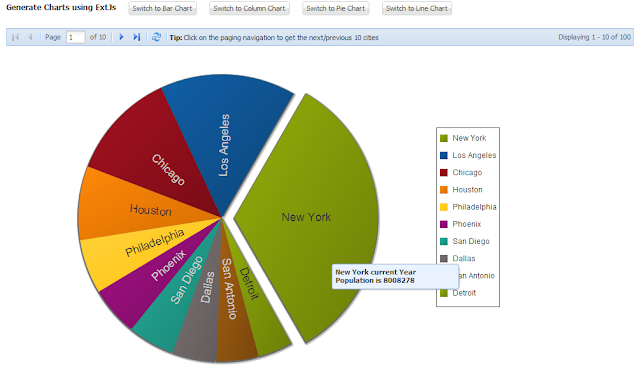
Ext.chart.Chart is the most important class here for rendering charts. To display a chart you have to configure one or more series. Series are responsible for the visual representation of the data points contained in the Store. Now in the case of a Bar Chart or Line Chart you also have to define the axes. Axes are the lines that define the boundaries of the data points that a Chart can display such as horizontal "x" axis, and a vertical "y" axis.
When the data appearing in a chart contains multiple variables, the chart may include a legend. A legend contains a list of the variables appearing in the chart and an example of their appearance. This information allows the data from each variable to be identified in the chart.
EclipseChartProject
 - Java Resources
  - src
   - com.as400samplecode
    - USCities.java
   - com.as400samplecode.util
    - City.java
    - CityInformation.java
 - Web Content
  - app
   - chart
    - controller
     - DisplayChart.js
    - model
     - City.js
    - store
     - Cities.js
    - view
     - CityBarChart.js
     - CityColumnChart.js
     - CityLineChart.js
     - CityPieChart.js
  - pages
   - index.jsp
  - resources
   - scripts
    - chart.js
  - META-INF
  - WEB-INF
To render any type of chart we need data. In these example we receive our data in JSON from from the MySQL database with the help of Java Servlets. Here is a sample JSON data used in the examples below
{"success":true,"cityList":[
{"id":3793,"name":"New York","country":"USA","district":"New York","population":8008278,"lastYearPopulation":6807036},
{"id":3794,"name":"Los Angeles","country":"USA","district":"California","population":3694820,"lastYearPopulation":3140597},
{"id":3795,"name":"Chicago","country":"USA","district":"Illinois","population":2896016,"lastYearPopulation":2461613},
{"id":3796,"name":"Houston","country":"USA","district":"Texas","population":1953631,"lastYearPopulation":1660586},
{"id":3797,"name":"Philadelphia","country":"USA","district":"Pennsylvania","population":1517550,"lastYearPopulation":1289917},
{"id":3798,"name":"Phoenix","country":"USA","district":"Arizona","population":1321045,"lastYearPopulation":1122888},
{"id":3799,"name":"San Diego","country":"USA","district":"California","population":1223400,"lastYearPopulation":1039890},
{"id":3800,"name":"Dallas","country":"USA","district":"Texas","population":1188580,"lastYearPopulation":1010293},
{"id":3801,"name":"San Antonio","country":"USA","district":"Texas","population":1144646,"lastYearPopulation":972949},
{"id":3802,"name":"Detroit","country":"USA","district":"Michigan","population":951270,"lastYearPopulation":808579}],
"totalCount":100}
So let's go ahead and create the Java web service that will provide the ExtJs store with data. The data in our case is the Top 100 cities in United States by population and we fake the last year population as 85% from the current year for our demo.
Java Object - City.java
package com.as400samplecode.util;

public class City {

 int id = 0;
 String name = "";
 String country = "";
 String district = "";
 int population = 0;
 int lastYearPopulation = 0;

 public int getId() {
  return id;
 }
 public void setId(int id) {
  this.id = id;
 }
 public String getName() {
  return name;
 }
 public void setName(String name) {
  this.name = name;
 }
 public String getCountry() {
  return country;
 }
 public void setCountry(String country) {
  this.country = country;
 }
 public String getDistrict() {
  return district;
 }
 public void setDistrict(String district) {
  this.district = district;
 }
 public int getPopulation() {
  return population;
 }
 public void setPopulation(int population) {
  this.population = population;
 }
 public int getLastYearPopulation() {
  return lastYearPopulation;
 }
 public void setLastYearPopulation(int lastYearPopulation) {
  this.lastYearPopulation = lastYearPopulation;
 }

}
Java Utility class to get cities based on range - CityInformation.java
package com.as400samplecode.util;

import java.sql.Connection;
import java.sql.ResultSet;
import java.sql.SQLException;
import java.sql.PreparedStatement;
import java.util.ArrayList;

import javax.naming.Context;
import javax.naming.InitialContext;
import javax.sql.DataSource;

public class CityInformation {

 Connection conn = null;
 PreparedStatement stmt = null;
 String sql = null;

 public ArrayList<City> getCities(String start, String limit) {

  ArrayList<City> cityList = new ArrayList<City>();

  try {
   Context ctx = (Context) new InitialContext().lookup("java:comp/env");
   conn = ((DataSource) ctx.lookup("jdbc/mysql")).getConnection();

   sql = "SELECT * FROM city where countrycode = 'USA' order by population desc LIMIT ?,?";
   stmt = conn.prepareStatement(sql);
   stmt.setInt(1, Integer.parseInt(start));
   stmt.setInt(2, Integer.parseInt(limit));
   ResultSet rs = stmt.executeQuery();

   while(rs.next()){
    City city = new City();
    city.setId(rs.getInt("id"));
    city.setName(rs.getString("name").trim());
    city.setCountry(rs.getString("countrycode").trim());
    city.setDistrict(rs.getString("district").trim());
    city.setPopulation(rs.getInt("population"));
    city.setLastYearPopulation((int) (rs.getInt("population") * 0.85));
    cityList.add(city);
   }

   rs.close();
   stmt.close();
   stmt = null;


   conn.close();
   conn = null;

  }
  catch(Exception e){System.out.println(e);}

  finally {
   if (stmt != null) {
    try {
     stmt.close();
    } catch (SQLException sqlex) {
     // ignore -- as we can't do anything about it here
    }

    stmt = null;
   }

   if (conn != null) {
    try {
     conn.close();
    } catch (SQLException sqlex) {
     // ignore -- as we can't do anything about it here
    }

    conn = null;
   }
  }

  return cityList;

 }

}
Java Servlet providing JSON data for our Cities - USCities.java
package com.as400samplecode;

import java.io.IOException;
import java.io.PrintWriter;
import java.util.ArrayList;

import javax.servlet.ServletException;
import javax.servlet.http.HttpServlet;
import javax.servlet.http.HttpServletRequest;
import javax.servlet.http.HttpServletResponse;

import com.as400samplecode.util.City;
import com.as400samplecode.util.CityInformation;
import com.google.gson.Gson;
import com.google.gson.JsonArray;
import com.google.gson.JsonElement;
import com.google.gson.JsonObject;

public class USCities extends HttpServlet {
 private static final long serialVersionUID = 1L;

 public USCities() {
  super();
 }

 protected void doGet(HttpServletRequest request, HttpServletResponse response) throws ServletException, IOException {
  doPost(request,response);
 }

 protected void doPost(HttpServletRequest request, HttpServletResponse response) throws ServletException, IOException {

  String start = request.getParameter("start");
  String limit = request.getParameter("limit");

  PrintWriter out = response.getWriter();
  response.setContentType("text/html");

  CityInformation cityInformation = new CityInformation();
  ArrayList<City> cityList = cityInformation.getCities(start,limit);

  Gson gson = new Gson();
  JsonArray arrayObj = new JsonArray();
  for(int i=0;i<cityList.size();i++){
   City city = cityList.get(i);
   JsonElement cityObj = gson.toJsonTree(city);
   arrayObj.add(cityObj);
  }

  JsonObject myObj = new JsonObject();
  myObj.addProperty("success", true);
  myObj.add("cityList", arrayObj);
  myObj.addProperty("totalCount", 100);

  out.println(myObj.toString());
  out.close();

 }


}
Now let's move on to our front end programming. Here we create a container and then render the chart inside that. We have buttons to switch between various different types of charts such as Bar Chart, Column Chart, Pie Chart and Line chart. We have to create views for each type of chart but share the same model, store and controller.
Application JSP file - index.jsp
<%@ page language="java" contentType="text/html; charset=ISO-8859-1"
    pageEncoding="ISO-8859-1"%>
<%@ page import="java.io.*" %>
<!DOCTYPE html PUBLIC "-//W3C//DTD HTML 4.01 Transitional//EN" "http://www.w3.org/TR/html4/loose.dtd">
<html>

<head>
<meta http-equiv="Content-Type" content="text/html; charset=ISO-8859-1">
<meta name="robots" content="noindex,nofollow"/>
<title>Programmers sample guide, help is on the way</title>
<link rel="stylesheet" type="text/css"  href="/extjs/resources/css/ext-all.css">
<script type="text/javascript" src="/extjs/ext-all-debug.js"></script>
<script type="text/javascript" src="../resources/scripts/chart.js"></script>
</head>

<body>
<div id="allContent">
<%
String chartType = request.getParameter("chartType");
if(chartType == null){
 chartType = "bar";
}
%>
<input type="hidden" id="chartType" name="chartType" value="<%= chartType %>">

<div id="myExample">
</div>
</div>
</body>
</html>
Application JavaScript file - chart.js
Ext.Loader.setConfig({
 enabled: true
});

Ext.require([
     'Ext.chart.*',
     'Ext.fx.target.Sprite',
     'Ext.fx.target.Sprite',
     'Ext.layout.container.Fit'
]);

Ext.define('MySharedData', {
    singleton: true,
    currentChart: 'bar',
});

Ext.application({

 name: 'DEMO',

    appFolder: '/ExtJs/app/chart',

    controllers: [
                  'DisplayChart'
              ],

              launch: function() {
               Ext.create('Ext.container.Container', {
                margin: 10,
                renderTo: 'myExample',
                id: 'myChartContainer',
                defaults: {
                 margin: 10,
                },
                items: [{
                  xtype: 'label',
                  html: '<b>Generate Charts using ExtJs</b>'
                   },
                {
                 xtype: 'button',
                 text: 'Switch to Bar Chart',
                 action: 'typeA',
                },
                {
                 xtype: 'button',
                 text: 'Switch to Column Chart',
                 action: 'typeB',
                },
                {
                 xtype: 'button',
                 text: 'Switch to Pie Chart',
                 action: 'typeC',
                },
                {
                 xtype: 'button',
                 text: 'Switch to Line Chart',
                 action: 'typeD',
                },
                {
                xtype: 'pagingtoolbar',
                   store: 'Cities',
                   dock: 'bottom',
                   displayInfo: true,
                   items: [
                           {
                            xtype: 'tbseparator'
                           },
                           {
                            xtype: 'label',
                           html: '<b>Tip: </b>Click on the paging navigation to get the next/previous 10 cities'

                     }
                   ]
                }]
               });
              }

});
Source for application model - City.js
Ext.define('DEMO.model.City', {
    extend: 'Ext.data.Model',
    fields: ['name',
             'population',
             'lastYearPopulation']
});
Source for application store - Cities.js
Ext.define('DEMO.store.Cities', {
    extend: 'Ext.data.Store',
    model: 'DEMO.model.City',
    autoLoad: true,
    pageSize: 10,

    proxy: {
        type: 'ajax',
        url: '../USCities',
        reader: {
            type: 'json',
            root: 'cityList',
            totalProperty: 'totalCount',
            successProperty: 'success'
        },
  }
});
Source for application controller - DisplayChart.js
Ext.define('DEMO.controller.DisplayChart', {

   extend : 'Ext.app.Controller',

   //define the stores
   stores : ['Cities'],
   //define the models
   models : ['City'],
   //define the views
   views : ['CityBarChart','CityColumnChart','CityPieChart','CityLineChart'],

   init : function() {
    this.control({

     'container[id=myChartContainer]' : {
      afterrender : this.onPanelRendered
     },
     'container button[action=typeA]' : {
      click : this.onBarTypeChart
     },
     'container button[action=typeB]' : {
      click : this.onColumnTypeChart
     },
     'container button[action=typeC]' : {
      click : this.onPieTypeChart
     },
     'container button[action=typeD]' : {
      click : this.onLineTypeChart
     }

    });
   },

   onBarTypeChart: function(button) {
    var view = button.up('container');
    this.onCleanChart(view);
    MySharedData.currentChart = 'bar';
    view.add(Ext.widget("cityBarChart"));
   },

   onColumnTypeChart: function(button) {
    var view = button.up('container');
    this.onCleanChart(view);
    MySharedData.currentChart = 'column';
    view.add(Ext.widget("cityColumnChart"));
   },

   onPieTypeChart: function(button) {
    var view = button.up('container');
    this.onCleanChart(view);
    MySharedData.currentChart = 'pie';
    view.add(Ext.widget("cityPieChart"));
   },

   onLineTypeChart: function(button) {
    var view = button.up('container');
    this.onCleanChart(view);
    MySharedData.currentChart = 'line';
    view.add(Ext.widget("cityLineChart"));
   },

   onCleanChart: function(view){
    if(MySharedData.currentChart === 'bar'){
     view.remove(Ext.getCmp("cityBarChart"),true);
    }
    if(MySharedData.currentChart === 'column'){
     view.remove(Ext.getCmp("cityColumnChart"),true);
    }
    if(MySharedData.currentChart === 'pie'){
     view.remove(Ext.getCmp("cityPieChart"),true);
    }
    if(MySharedData.currentChart === 'line'){
     view.remove(Ext.getCmp("cityLineChart"),true);
    }

   },

   onPanelRendered : function(view) {
    var chartType = document.getElementById("chartType").value;
    if(chartType === 'bar'){
     MySharedData.currentChart = 'bar';
     view.add(Ext.widget("cityBarChart"));
    }
    if(chartType === 'column'){
     MySharedData.currentChart = 'column';
     view.add(Ext.widget("cityColumnChart"));
    }
    if(chartType === 'pie'){
     MySharedData.currentChart = 'pie';
     view.add(Ext.widget("cityPieChart"));
    }
    if(chartType === 'line'){
     MySharedData.currentChart = 'line';
     view.add(Ext.widget("cityLineChart"));
    }
   },

});
Source for Bar Chart - CityBarChart.js
Ext.define('DEMO.view.CityBarChart' ,{
    extend: 'Ext.chart.Chart',
    alias : 'widget.cityBarChart',
    id: 'cityBarChart',

    height: 600,
    width: 1000,
    animate: true,
    shadow: true,
    store : 'Cities',
    theme: 'Base',
    legend: {
        position: 'bottom'
    },

    axes: [{
        type: 'Numeric',
        position: 'bottom',
        fields: ['population','lastYearPopulation'],
        label: {
            renderer: Ext.util.Format.numberRenderer('0,0')
        },
        title: 'Population',
        grid: true,
        minimum: 100000,
        majorTickSteps: 15
    }, {
        type: 'Category',
        position: 'left',
        fields: ['name'],
        title: 'US Cities'
    }],
    series: [{
        type: 'bar',
        axis: 'bottom',
        highlight: true,
        tips: {
          trackMouse: true,
          width: 200,
          height: 40,
          renderer: function(storeItem, item) {
           var currentYear = true;
           for( var i = 0; i < item.series.items.length; i++ ){
                  if( item == item.series.items[i] ){
                    itemsPerRec = item.series.items.length / item.storeItem.store.getCount();
                    if(item.series.yField[ i % itemsPerRec ] == "lastYearPopulation"){
                     currentYear = false;
                    };
                  }
              }

           if(currentYear){
            this.setTitle(storeItem.get('name') + ' current Year<br/>Population is ' + storeItem.get('population'));
           }
           else {
            this.setTitle(storeItem.get('name') + ' last Year<br/>Population is ' + storeItem.get('lastYearPopulation'));
              }
         }
        },
        label: {
            display: 'insideEnd',
            field: ['population','lastYearPopulation'],
            renderer: Ext.util.Format.numberRenderer('0'),
            orientation: 'horizontal',
            color: '#333',
            'text-anchor': 'middle'
        },
        xField: 'name',
        yField: ['population','lastYearPopulation'],
        title: ['Current Year', 'Last Year']
    }]

});
Source for Column Chart - CityColumnChart.js
Ext.define('DEMO.view.CityColumnChart' ,{
    extend: 'Ext.chart.Chart',
    alias : 'widget.cityColumnChart',
    id: 'cityColumnChart',

    height: 600,
    width: 1000,
    animate: true,
    shadow: true,
    store : 'Cities',
    theme: 'Base',
    legend: {
        position: 'float',
        x: 800,
        y: 0
    },

    axes: [{
        type: 'Numeric',
        position: 'left',
        fields: ['population','lastYearPopulation'],
        label: {
            renderer: Ext.util.Format.numberRenderer('0,0')
        },
        title: 'Population',
        grid: true,
        minimum: 100000,
        majorTickSteps: 15
    }, {
        type: 'Category',
        position: 'bottom',
        fields: ['name'],
        title: 'US Cities'
    }],
    series: [{
        type: 'column',
        axis: 'left',
        highlight: true,
        tips: {
          trackMouse: true,
          width: 200,
          height: 40,
          renderer: function(storeItem, item) {
           var currentYear = true;
           for( var i = 0; i < item.series.items.length; i++ ){
                  if( item == item.series.items[i] ){
                    itemsPerRec = item.series.items.length / item.storeItem.store.getCount();
                    if(item.series.yField[ i % itemsPerRec ] == "lastYearPopulation"){
                     currentYear = false;
                    };
                  }
              }

           if(currentYear){
            this.setTitle(storeItem.get('name') + ' current Year<br/>Population is ' + storeItem.get('population'));
           }
           else {
            this.setTitle(storeItem.get('name') + ' last Year<br/>Population is ' + storeItem.get('lastYearPopulation'));
              }
         }
        },
        label: {
          display: 'insideEnd',
            field: ['population','lastYearPopulation'],
            renderer: Ext.util.Format.numberRenderer('0'),
            orientation: 'vertical',
            color: '#333',
          'text-anchor': 'middle'
        },
        xField: 'name',
        yField: ['population','lastYearPopulation'],
        title: ['Current Year', 'Last Year']
    }]

});
Source for Pie Chart - CityPieChart.js
Ext.define('DEMO.view.CityPieChart' ,{
    extend: 'Ext.chart.Chart',
    alias : 'widget.cityPieChart',
    id: 'cityPieChart',

    height: 500,
    width: 800,
    animate: true,
    shadow: true,
    store : 'Cities',
    theme: 'Base:gradients',
    legend: {
        position: 'right'
    },
    insetPadding: 25,

    series: [{
        type: 'pie',
        field: 'population',
        highlight: true,
        showInLegend: true,
        tips: {
          trackMouse: true,
          width: 200,
          height: 40,
          renderer: function(storeItem, item) {
             this.setTitle(storeItem.get('name') + ' current Year<br/>Population is ' + storeItem.get('population'));
         }
        },
        label: {
            display: 'rotate',
            field: 'name',
            font: '18px Arial',
            contrast: true
        },
        highlight: {
          segment: {
            margin: 20
          }
        },
    }]

});
Source for Line Chart - CityLineChart.js
Ext.define('DEMO.view.CityLineChart' ,{
    extend: 'Ext.chart.Chart',
    alias : 'widget.cityLineChart',
    id: 'cityLineChart',

    height: 600,
    width: 1000,
    animate: true,
    shadow: true,
    store : 'Cities',
    theme: 'Base',
    legend: {
        position: 'bottom'
    },

    axes: [{
        type: 'Numeric',
        position: 'left',
        fields: ['population','lastYearPopulation'],
        label: {
            renderer: Ext.util.Format.numberRenderer('0,0')
        },
        title: 'Population',
        grid: true,
        minimum: 100000,
        majorTickSteps: 15
    }, {
        type: 'Category',
        position: 'bottom',
        fields: ['name'],
        title: 'US Cities'
    }],
    series: [{
        type: 'line',
        axis: 'left',
        highlight: true,
        tips: {
          trackMouse: true,
          width: 200,
          height: 40,
          renderer: function(storeItem, item) {
             this.setTitle(storeItem.get('name') + ' current Year<br/>Population is ' + storeItem.get('population'));
          }
        },
        xField: 'name',
        yField: ['population'],
        title: ['Current Year']
    },
    {
        type: 'line',
        axis: 'left',
        highlight: true,
        tips: {
          trackMouse: true,
          width: 200,
          height: 40,
          renderer: function(storeItem, item) {
             this.setTitle(storeItem.get('name') + ' last Year<br/>Population is ' + storeItem.get('lastYearPopulation'));
          }
        },
        xField: 'name',
        yField: ['lastYearPopulation'],
        title: ['Last Year']
    }]

});


1 comment:
how to show these data on grids tab panel???
Post a Comment
NO JUNK, Please try to keep this clean and related to the topic at hand.
Comments are for users to ask questions, collaborate or improve on existing.